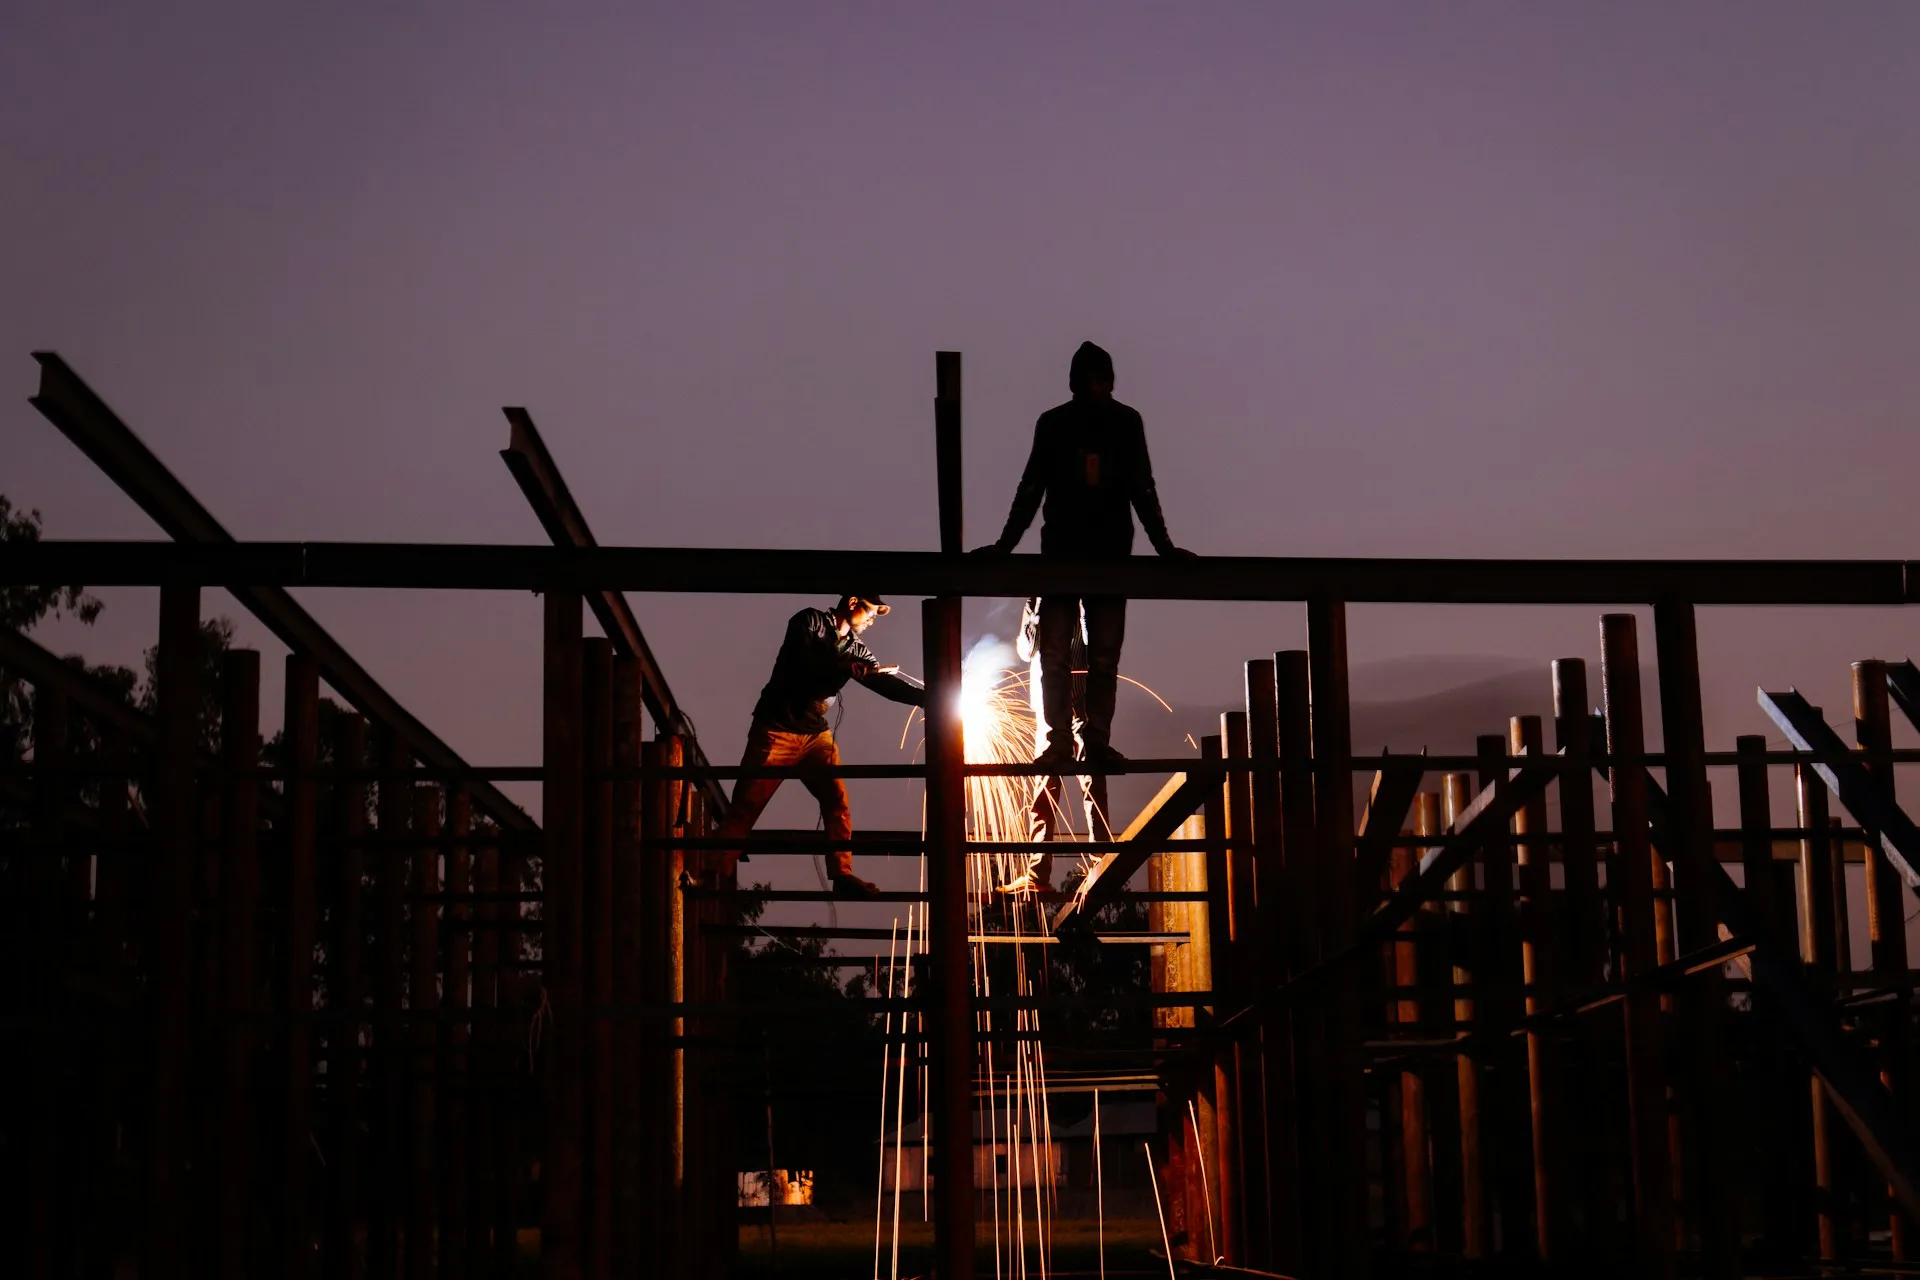
Shift work to 9pm–5am
ROI Immediate payback Construction site Avignon
Schedule delay 23 days/year

A platform to turn climate risks into concrete decisions: identify vulnerabilities, quantify business impacts and prioritise adaptation actions.
Built to manage climate risk at every level of the enterprise.
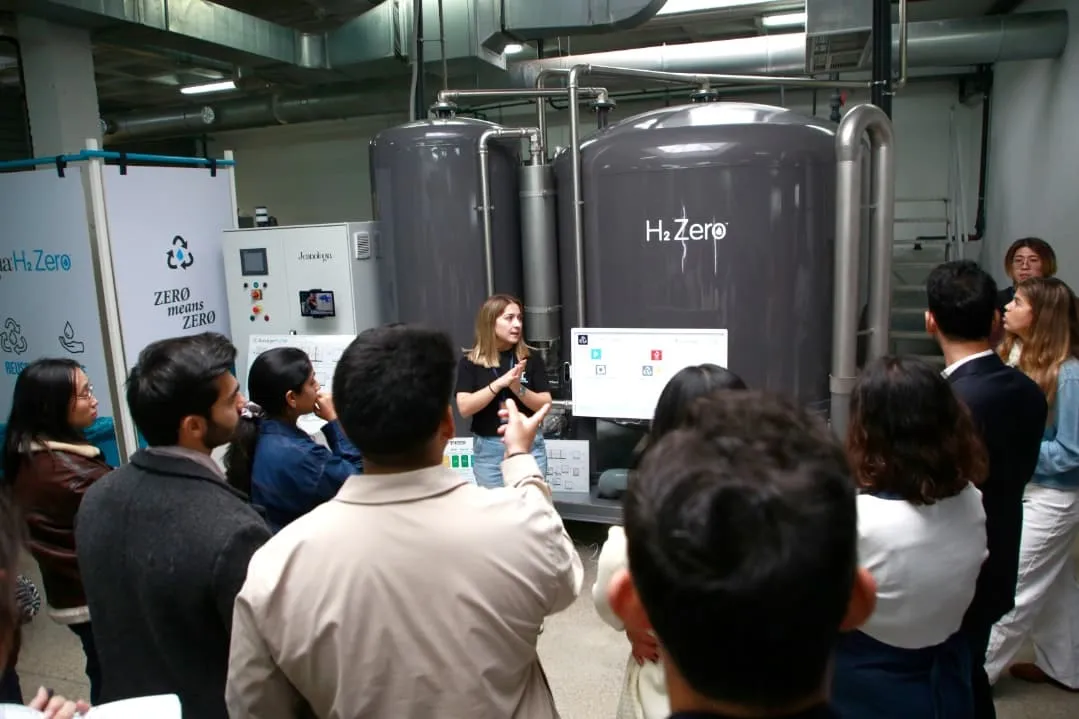
Climate hazards do not hit a single link — their impacts propagate downstream, amplified at every stage.
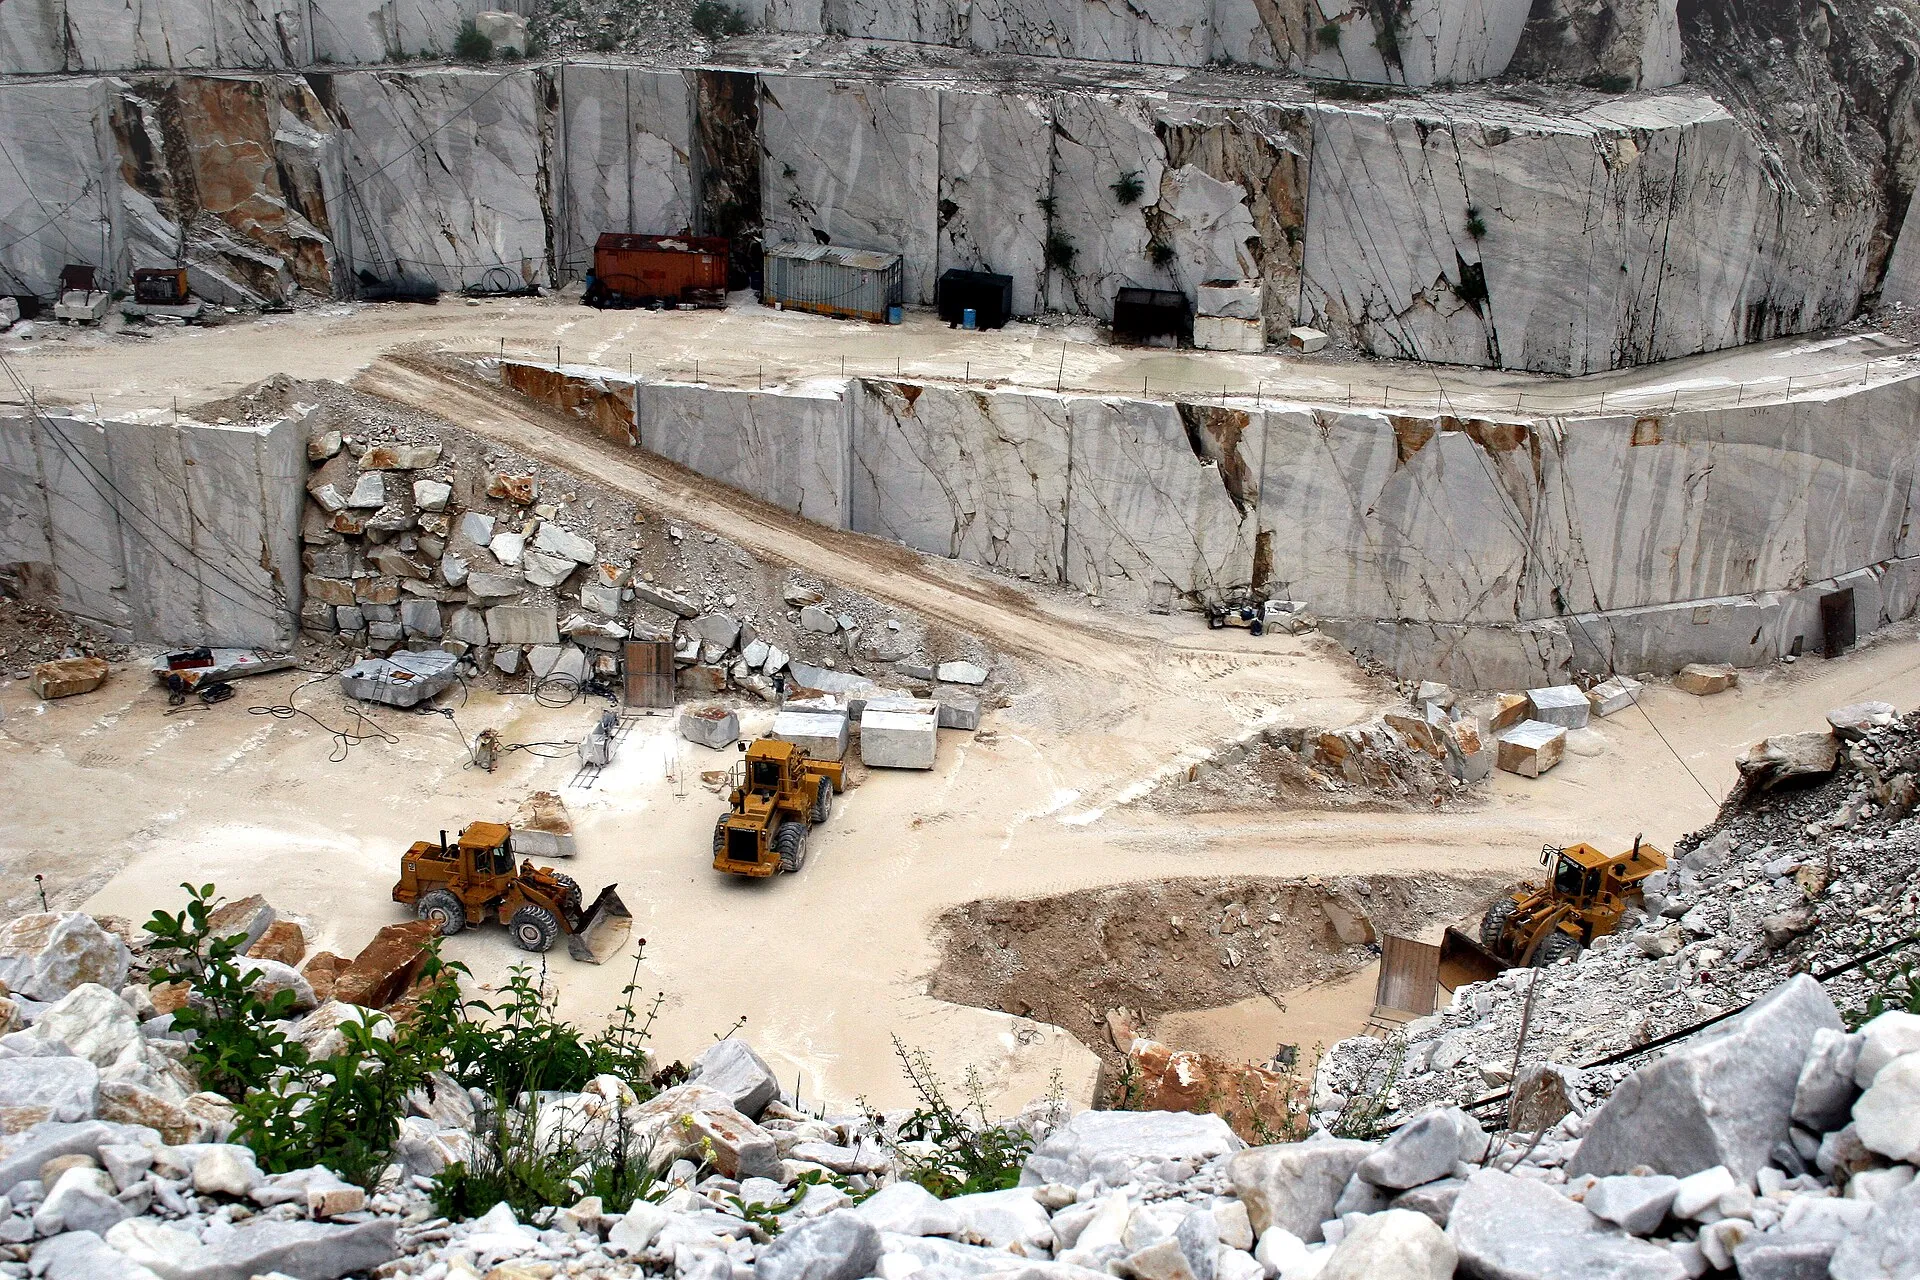
Raw materials, suppliers, inbound logistics
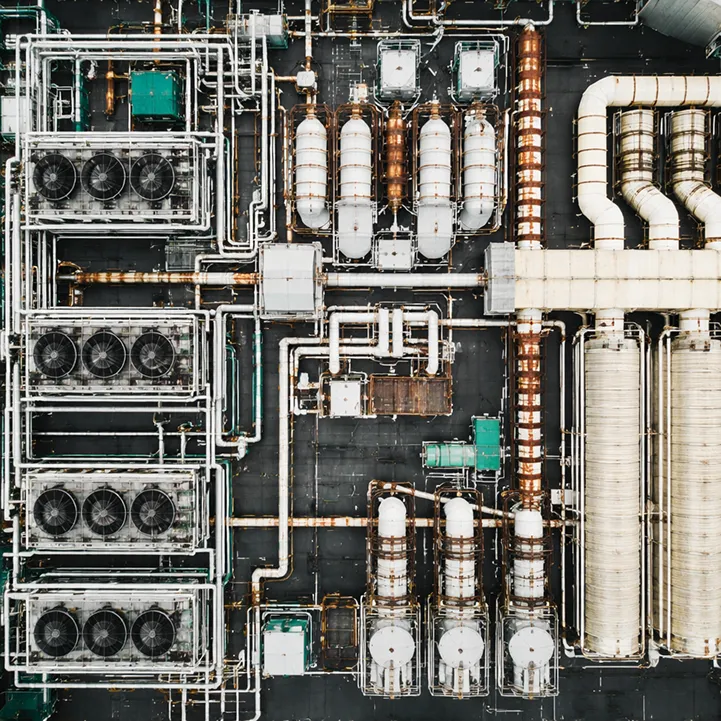
Sites, assets, energy, workforce
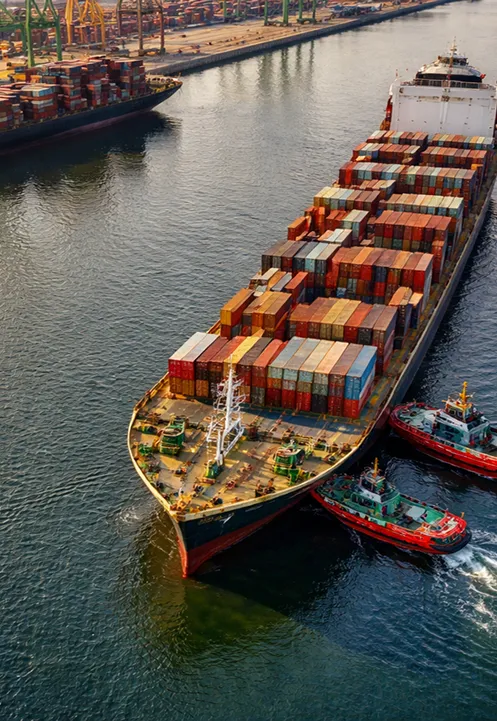
Distribution, customers, markets
Exposure maps, climate scores, long-term scenarios: these analyses often struggle to guide field teams on which vulnerabilities to address, which assets are affected and which actions to prioritise.
Without estimating damages, operating losses, cost increases or ROI of actions, adaptation remains hard to compare with other business priorities and to integrate into investment decisions.
Ad-hoc diagnostics, heterogeneous files, non-comparable data, reporting requirements: companies need a consolidated view to track their risks and steer adaptation over time.
Azard turns climate data and the operational realities of your activities into decision indicators: risk scores, financial impacts, action priorities and adaptation trajectories.
See how it worksIdentify and quantify risks, from operated sites to the value chain.
Azard Screen analyses the exposure and vulnerability of your operated sites and critical dependencies. The module ranks hazards, vulnerabilities and business impacts to target adaptation priorities, at the site and portfolio level.
Test adaptation scenarios and prioritise investments.
Track actions, coordinate teams and structure reporting.
Climate expertise, impact models and a platform — to turn analysis into adaptation decisions.
Models calibrated on your site typologies and operational realities — so field teams get a usable action plan, not just an exposure map.
Operating losses, cost increases, asset damages and the ROI of actions, quantified — to position adaptation alongside other investment priorities.
A comparable reading site by site, hazard by hazard — from a local action plan to the consolidated view used for Group steering and climate reporting.



The companies we serve, and the consulting and scientific partners we lean on.




Vulnerability is what sets two sites apart even when they face the same hazard. During a heat wave, equipment housed under a dark, heat-absorbing roof will overheat far faster than the same equipment under a reflective one.
It's from this reading — specific to each site and its activity — that the actions to take and their priority follow. And because it's expressed in operational terms, the diagnosis stays concrete and directly actionable.
On the contrary. We regularly partner with consultancies and would be glad to engage with them.
Azard is compatible with your existing analyses, whether internal risk models or prior studies with impact scores.
We use them as a starting point to go further on the most critical impacts and to scale across a large number of sites.
Yes, our approach adapts to any kind of site. For each typology, we build an impact and vulnerability model, which is then rolled out across a large number of sites.
In practice, a model strings together impact chains, for example: heatwaves → higher risk of equipment failure → business interruption. Each chain is parameterized (equipment type, cooling capacity, etc.).
The level of granularity simply depends on your data: we tune the parameters as close to each site as possible when the information is available, without blocking the rollout when it is not.
How it works// Next step
A 30-minute working session with one of our climate risk experts.
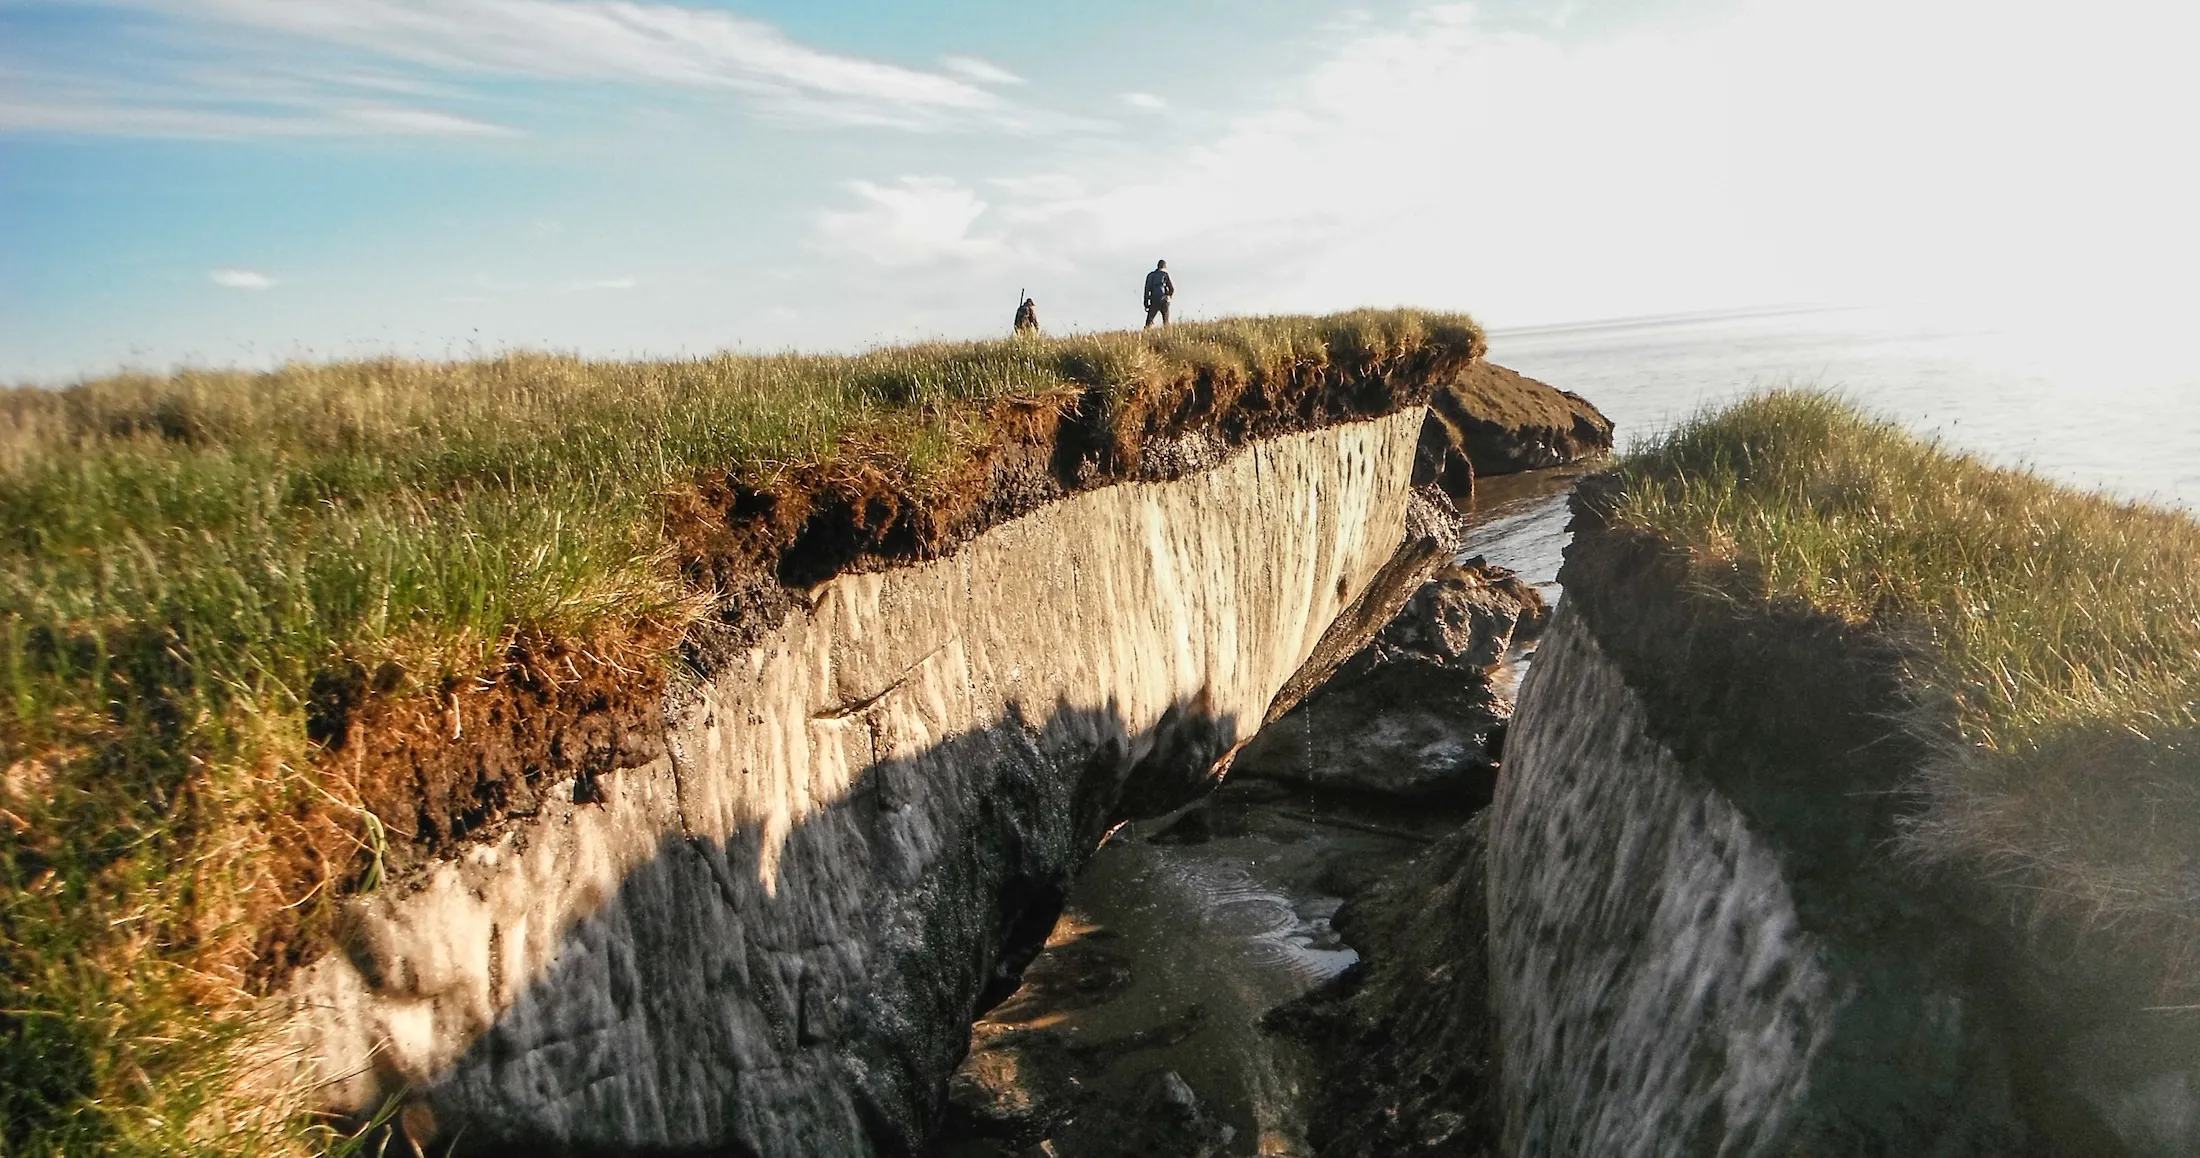
Coastal erosion revealing the extent of permafrost, Alaska. By Brandt Meixell/USGS, commons.wikimedia.org